Understand What’s Happening — And What’s Going to Happen Next
Mosaic turns planning data into live dashboards, variance reporting, and AI operational briefs so managers and leaders can see where time, budget, and schedule are tracking while there’s still time to act.

Static reports show you what happened. They can’t show you what’s changing.
By the time a static report lands, the window to act on it has already narrowed.
Mosaic gives you the clarity of reporting with the power of a live planning system.
Most firms don’t lack data. They lack a single view of it.
Financials live in the ERP. Plans live in spreadsheets. Allocation and skills live somewhere else. By the time someone pieces it all together, the issue is already affecting delivery, staffing, or the bottom line.
The plan and the actual never meet where you need them to
Without that connection, variance gets buried inside exports, side files, and meeting notes instead of showing up where managers can act on it.
- Teams act on outdated information
- Project drift gets noticed late
- PMs lose the chance to protect the budget
- Leadership finds out after the damage is done
Disconnected reporting doesn’t just slow you down — it gets unmanageable as you grow.
The issue isn’t a lack of effort. It’s that disconnected systems can’t scale the way operational decision-making needs them to.
- 10projects
A spreadsheet review might be enough. One person can hold the picture together.
- 25projects
Exports multiply. Reconciliation becomes a recurring project of its own.
- 50+projects
Teams spend more time assembling the picture than acting on it. The window to course-correct narrows.
Review what happened, or manage what’s going to happen.
- Closed financial history and point-in-time snapshots
- Spreadsheet exports and BI layers to piece things together
- Manual variance tracking across disconnected files
- Dashboards that still need interpretation and rework
- Live reporting connected to the plan and actuals
- Real-time dashboards with drill-down from firm to project
- Automatic variance tracking across time, budget, and schedule
- AI briefs that explain what changed and what needs attention
Mosaic turns planning data into operational insight
You shouldn't have to switch between software to get the information you need. Mosaic gives you everything you need to decide in one view.
Live Dashboards
See the bigger picture, then drill into the details — from firm to office, team, project, or role, all in one place.
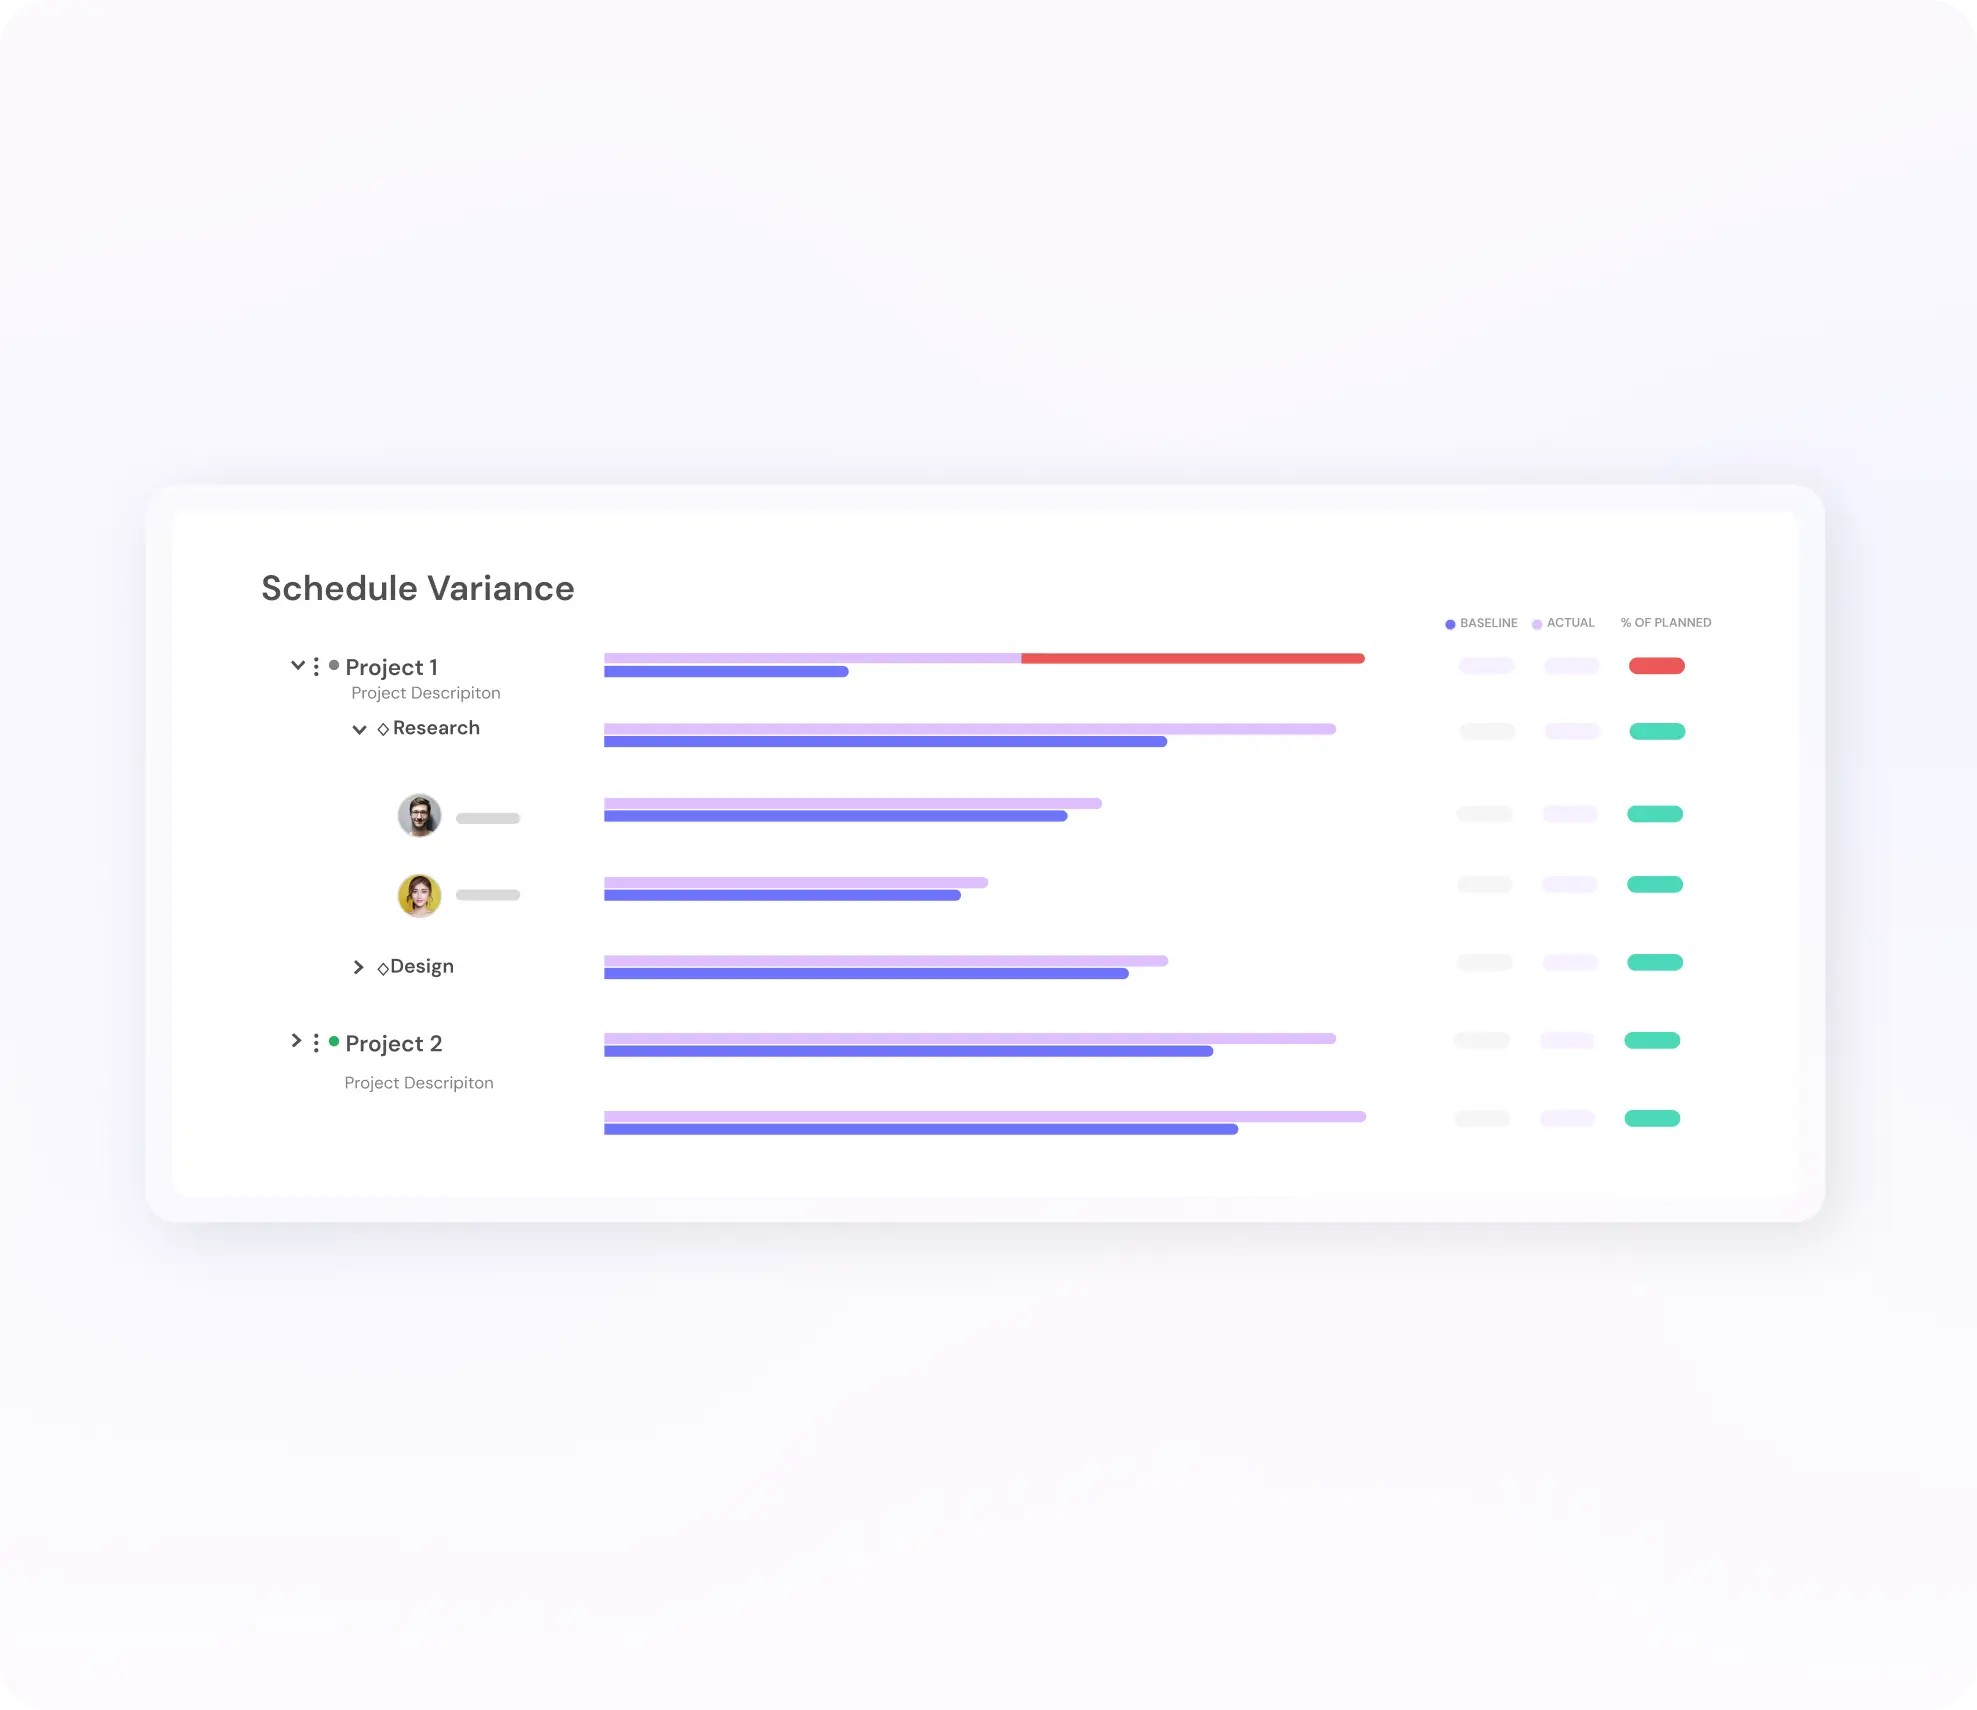
Variance Insight
Track schedule, time, and budget variance to see where reality is moving off plan and course-correct before it compounds.
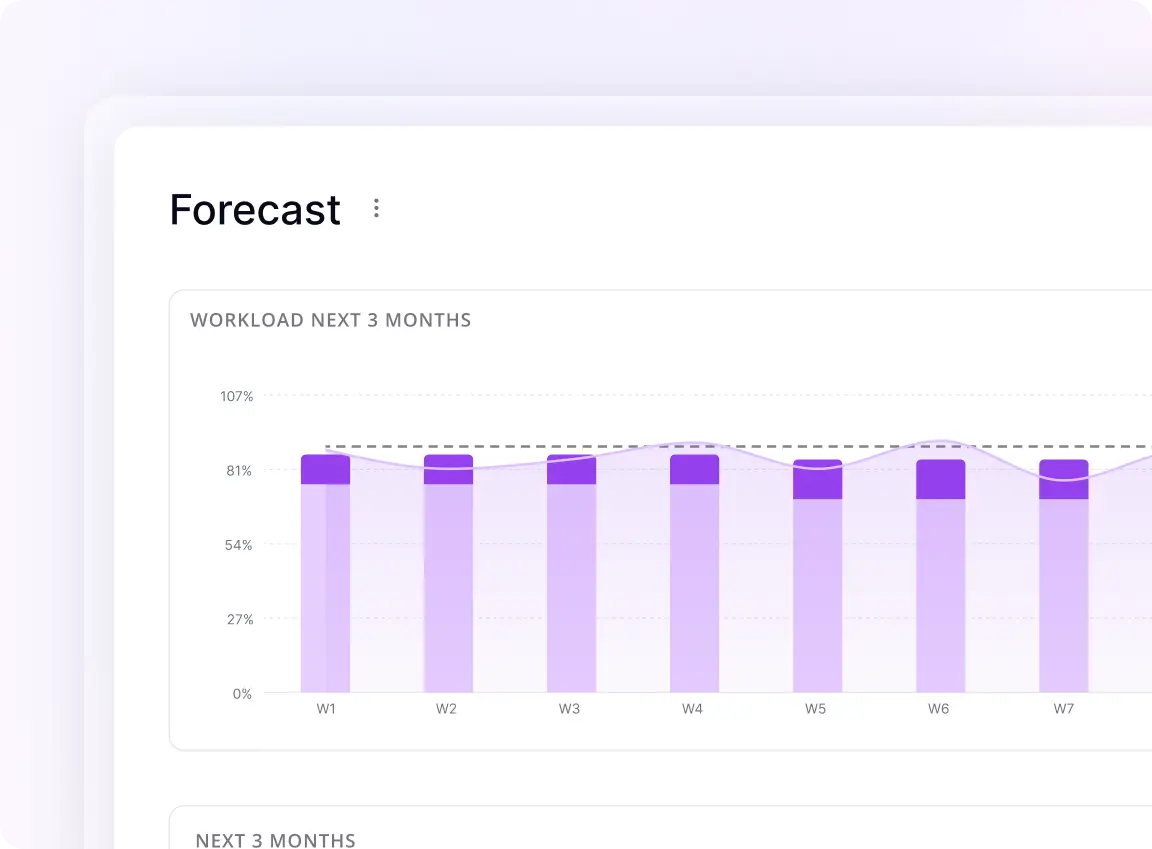
Forecasting
EAC shows where the project is heading. Forecast to complete shows what’s left. Stop reacting — start seeing where projects are going.
Why static reports can’t do this
Static reports don’t stay current, don’t connect the plan to reality, and don’t scale across teams. They multiply complexity instead of reducing it.
Mosaic replaces after-the-fact reporting with earlier, better decisions.

What changes when you move off spreadsheets

Planned
Understand where time is expected to go across the firm and how planned time compares to available capacity.

Workload
See who has room, who is overloaded, and where work should move before it becomes a delivery problem.

Utilization
Understand whether time is being used where the business expects value and separate busy from productive.

Variance
See where reality is moving off course across schedule, time, and budget so teams can correct early.

Backlog
See committed work and future pressure so teams can plan ahead instead of reacting to what’s already overdue.

Role Demand
Spot structural bottlenecks earlier and see where hiring or reallocation is needed before gaps affect delivery.
Turn planning data into weekly briefs and monthly reporting
Most firms don’t need more dashboards. They need a clearer picture of what changed and where time, budget, and schedule stand against the plan.
Mosaic AI turns planning data and actuals into automated weekly briefs and monthly reporting so teams can stay ahead of workload, delivery, utilization, and variance issues without waiting for a manual report cycle.
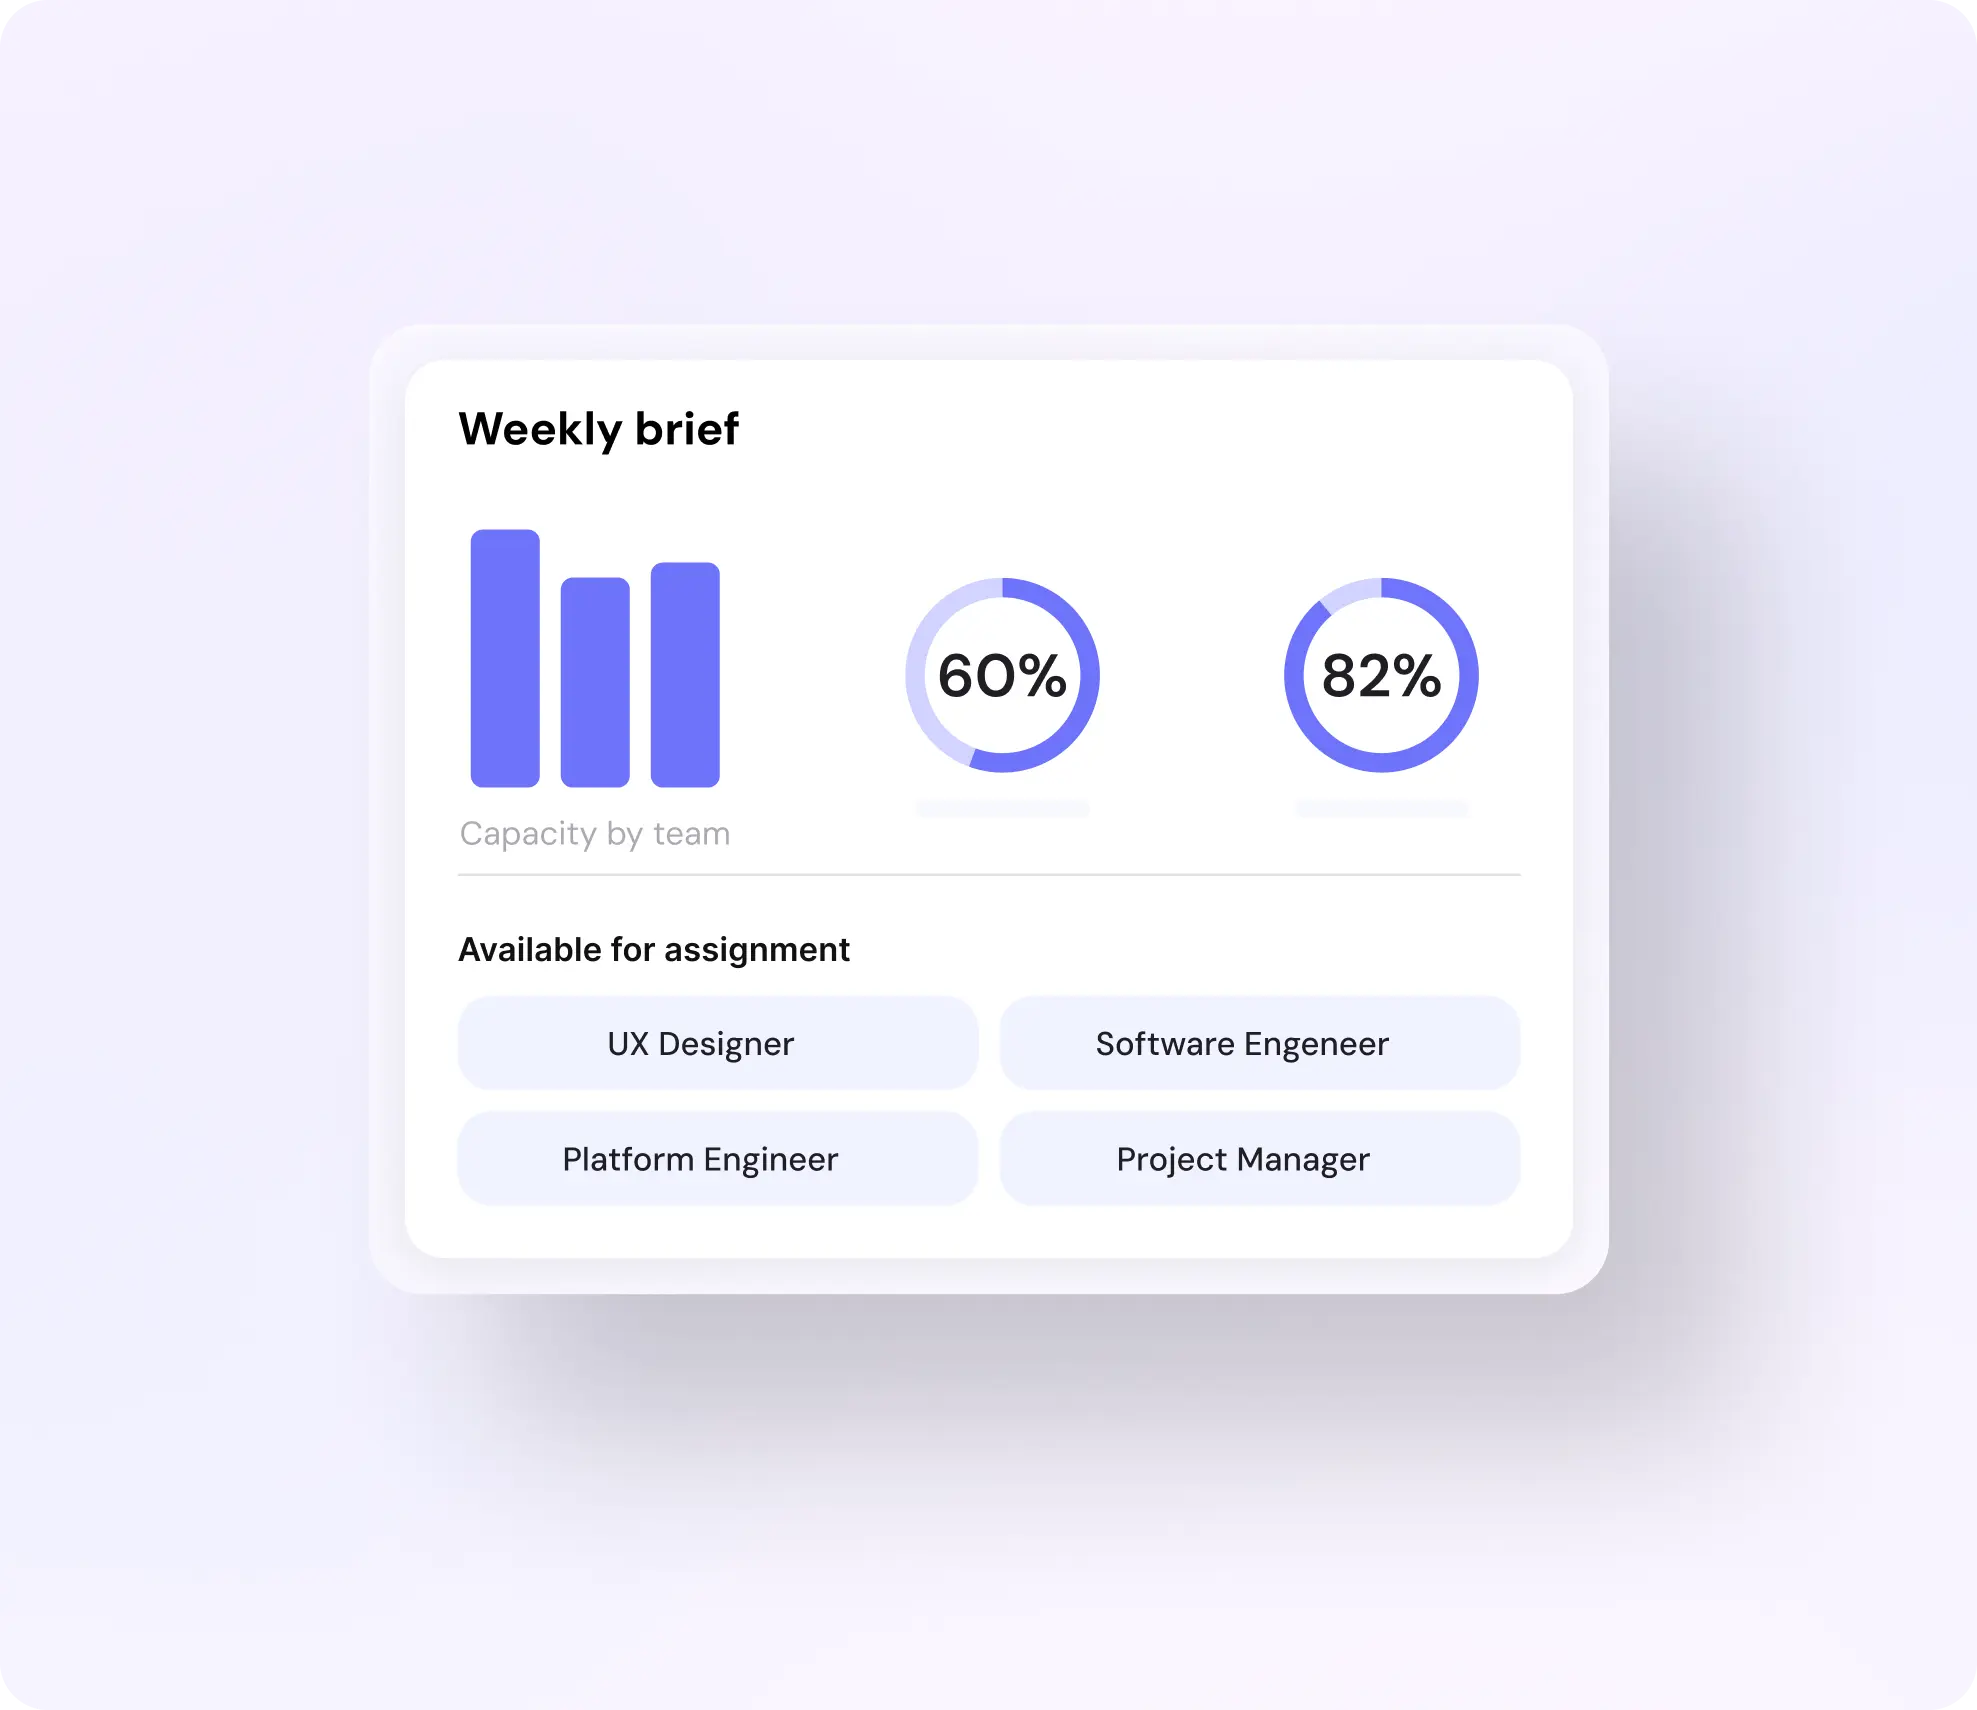
Weekly briefs
See what changed, what needs a decision, and where workload, schedule, budget, or profit is starting to drift.
Monthly reporting
See bigger patterns across delivery, workload, utilization, and variance so leadership can understand where the business is tracking to plan, where it’s moving off course, and what needs attention next.
Move beyond scattered reporting
With Mosaic, firms gain the clarity to act earlier and manage with context instead of managing in the dark.
- Clearer visibility into where projects are tracking off course
- Faster understanding of time, budget, and schedule performance
- More usable workload, utilization, backlog, and role-demand signals
- Earlier action from weekly briefs and monthly reporting
- Better delivery predictability and stronger profit
- One system where every team sees the same picture

If projects and people are critical to your firm, you need more than exports and month-end reports
You need a platform that turns planning data into live, connected, actionable insight — built on the plan, so every number means something.