

Forecast workload, revenue, and hiring with confidence
Mosaic AI forecasts workload, revenue, and hiring as projects, staffing, proposals, and budgets change. One Forecast view: base, growth, and conservative cases, progress against target, and insights with the action attached.
Better forecast accuracy. Stronger profit.
For most firms, planning data lives in the ERP, dozens of spreadsheets, a project tool that doesn’t understand capacity, and a BI dashboard trying to make sense of it all.
+2 – 4%
profit margin increase
~$1M
additional profit per year
Illustrative example for a 100-person firm. 12% profit + 2-4% = 17-33% increase in profit
Forecasting is so complex that most firms struggle to do it well—if at all.
.webp)


.webp)
.webp)

Projects rarely start or end according to plan, and some never get planned at all. Combine that with deadlines slipping, projects pausing, and new work kicking off and the forecast is stale by the time leaders review it.
.svg)
Knowing in advance when you’re going to need to hire in order to meet future backlog is to some extent the holy grail of the professional services industry.
A new standard in resource forecasting
AI resource forecasting shows the supply of people against the demand for work: whether you have enough, how much more you need, and what to hire when demand exceeds capacity.
- A monthly or quarterly spreadsheet exercise
- An incomplete view of pipeline, capacity, and billing
- One number with little context
- Hiring decisions happen reactively
- Risk appears after revenue targets are missed

- A live forecast that updates as work changes
- One unified view of planning, pipeline, budgets, and billing
- Forecasts explained through clear drivers and business impact
- Role demand and headcount needs surfaced early
- Risk surfaced early enough to act
Forecast workload and revenue side by side
One view, two lenses. Switch between Workload (% of capacity or hours) and Revenue, filtered to any department, team, or office. See total forecast, backlog, planned and unplanned pipeline, and actual against target for the next 3 and 12 months.
.webp)
.webp)
Run base, growth, and conservative cases
Mosaic AI builds each case from pipeline probability: Basecounts opportunities above 50%, Growth above 25%, Conservative above 75%. Each shows the opportunities it includes and the hours or dollars it adds. Pick the case to plan against, and every number follows.
See the quarter and the year against target
Week by week for the quarter, month by month for the year: committed work and pipeline stacked against the AI forecast line and your target line, with quarterly totals underneath. A soft quarter shows up early.
.webp)
Here we are at the end of July. And I’m trying to know what our staff is doing in October. Are we running off a cliff and nobody’s doing anything, or are we going to have so much work that we need to hire new people? Mosaic answers those questions.
Get the insight with the action attached
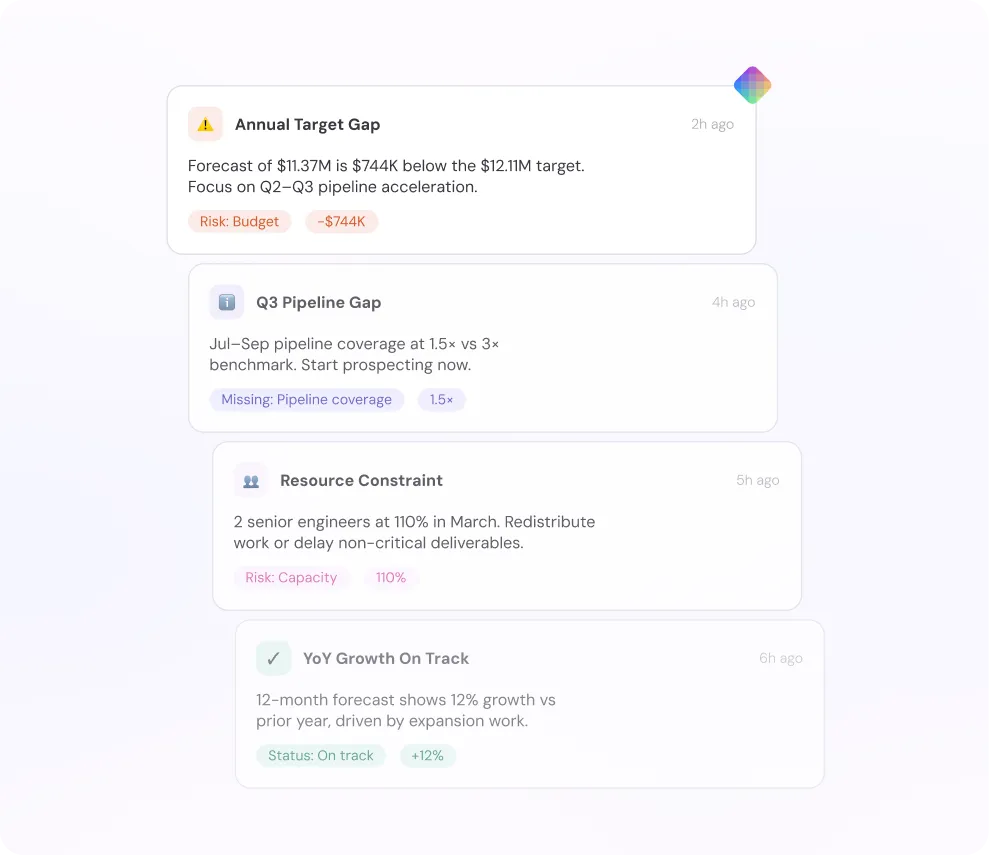
Beneath every chart, Mosaic AI reads the forecast and tells you what matters: who’s over capacity and when, contracts stalled, gaps against target, pipeline coverage against benchmark. Each comes with a recommended next step.
Track how your forecasts held up
Actual against forecast against target, by month and by quarter. See where past forecasts ran hot or cold. Mosaic AI uses that history to tighten the next one.
.webp)
.webp)
See which role to hire, and when
Mosaic AI shows role demand over time and when headcount is needed, so you hire the right people at the right time. It tells you whether demand is a spike or a sustained need, and whether redistributing work or contract help can bridge the gap first.
Build the forecast dashboard you need
Drag widgets onto the dashboard to shape the view for your role. Principals see the year against target. Ops sees role demand and constraints. Business development sees the funnel and stalled deals.
.webp)
What Mosaic AI weighs
Planned time, budgets, schedules, proposals, staffing, billing, and historical variance in one live system, plus outside data sources and industry benchmarks, re-forecast in real time as the business changes, across four drivers of accuracy.
.svg)
Capacity
Who’s available, who’s starting or leaving, PTO, and non-billable time.
.svg)
Pipeline
Proposals and tentative work, weighted by probability and by how much of it you choose to trust, and checked against industry pipeline benchmarks.
.svg)
Demand
Role demand from planned projects and phases: what roles does the contracted, committed, and pipeline work require.y

Delivery
How projects are actually tracking against plan, including historical variance and real-world factors.
Keep the forecast accurate
A forecast is only as accurate as the plan behind it. Chello watches the inputs every day: it flags issues as they appear, finds the gaps before they distort the number, and gets the people who own them to fill them in.

Flags issues as they appear
Who’s over capacity, who’s on the bench, budgets at risk, projects running past plan, proposals gone quiet. Flagged as they happen and in the weekly brief, each with a recommended fix.
Monitors data gaps
People with no plan, projects with no schedule, proposals missing a start date or a probability. Chello finds the holes before they skew the forecast.
Gets everyone planning
Chello nudges the person who owns each gap, so every project is scheduled and everyone is planned two to four weeks out. Complete data in, accurate forecast out.
Explains the number
What’s backlog, what’s pipeline, what moved since last week and why. You know how much of the forecast to lean on, and what would firm it up.
Find out exactly why the forecast changed or where it missed
Ask Chello why the number moved or where the last forecast came in wrong. It traces the change to the projects, people, and proposals behind it, and gets the gaps filled so the number firms up.
.webp)

Stop managing the business in the dark
AI resource forecasting gives leaders the confidence to lead the business: one Forecast view for workload, revenue, and hiring, updated as the work changes.
Plan better. Manage people better. Run the future with Mosaic.